Campaign Statistics
The Campaign Statistics screen presents a list of campaigns that have been sent from SendSage Studio. By default, this list presents all campaigns with the newest at the top.

Clicking on any of the column headers will sort the table by that column.
Clicking on that column again will reverse the order.
The “Export” button on the bottom left will download a CSV file with the data that exists on all pages of the current table. If any search criteria are present, this CSV file will honor that search.
Searching campaigns
Clicking the “Search” button will reveal several ways to filter the campaigns that are listed: by campaign name, campaign subject, mailing list, and starting date.

Additionally, you may elect to “Include Totals” in the search. This will render the table with a row summarizing all of the data across all pages of the table.
Clicks by URL
When viewing a list of campaign statistics, you may view the clicks, broken down by URL by clicking on the “CLICKS” link, then scrolling down to the “Clicks by URL” table:

Here are meanings of the figures in the above table:
| Unique Clicks | The number of unique clicks to the email that happened on this link. In other words: the number of subscribers where their first click was this link. The total of the “Unique Clicks” value for all of the links will total the number of “Unique Clicks” for the entire email. |
| Duplicate Clicks | The total number of clicks on the link, minus the number of Unique Clicks. |
| Unique Clicks by Link | The total number of unique subscribers that clicked on this link (whether it was their first click on the email or not). |
Exporting campaign clicks by URL
When viewing a list of campaign statistics, you may export a CSV file with the links that have been clicked on for each campaign. To do so, click the “Export Clicks by URL” button below the table. That CSV file will contain the following columns: Campaign ID, Campaign Name, URL, Unique Clicks, Duplicate Clicks, Unique Clicks by Link, and Click Through Rate.
The “Click Through Rate” for each link is calculated as the number of “Unique Clicks by Link” divided by the number of messages that were accepted for the campaign as a whole.
The file is organized by campaign in the same order as displayed in the table above.

Mailing list campaign statistics
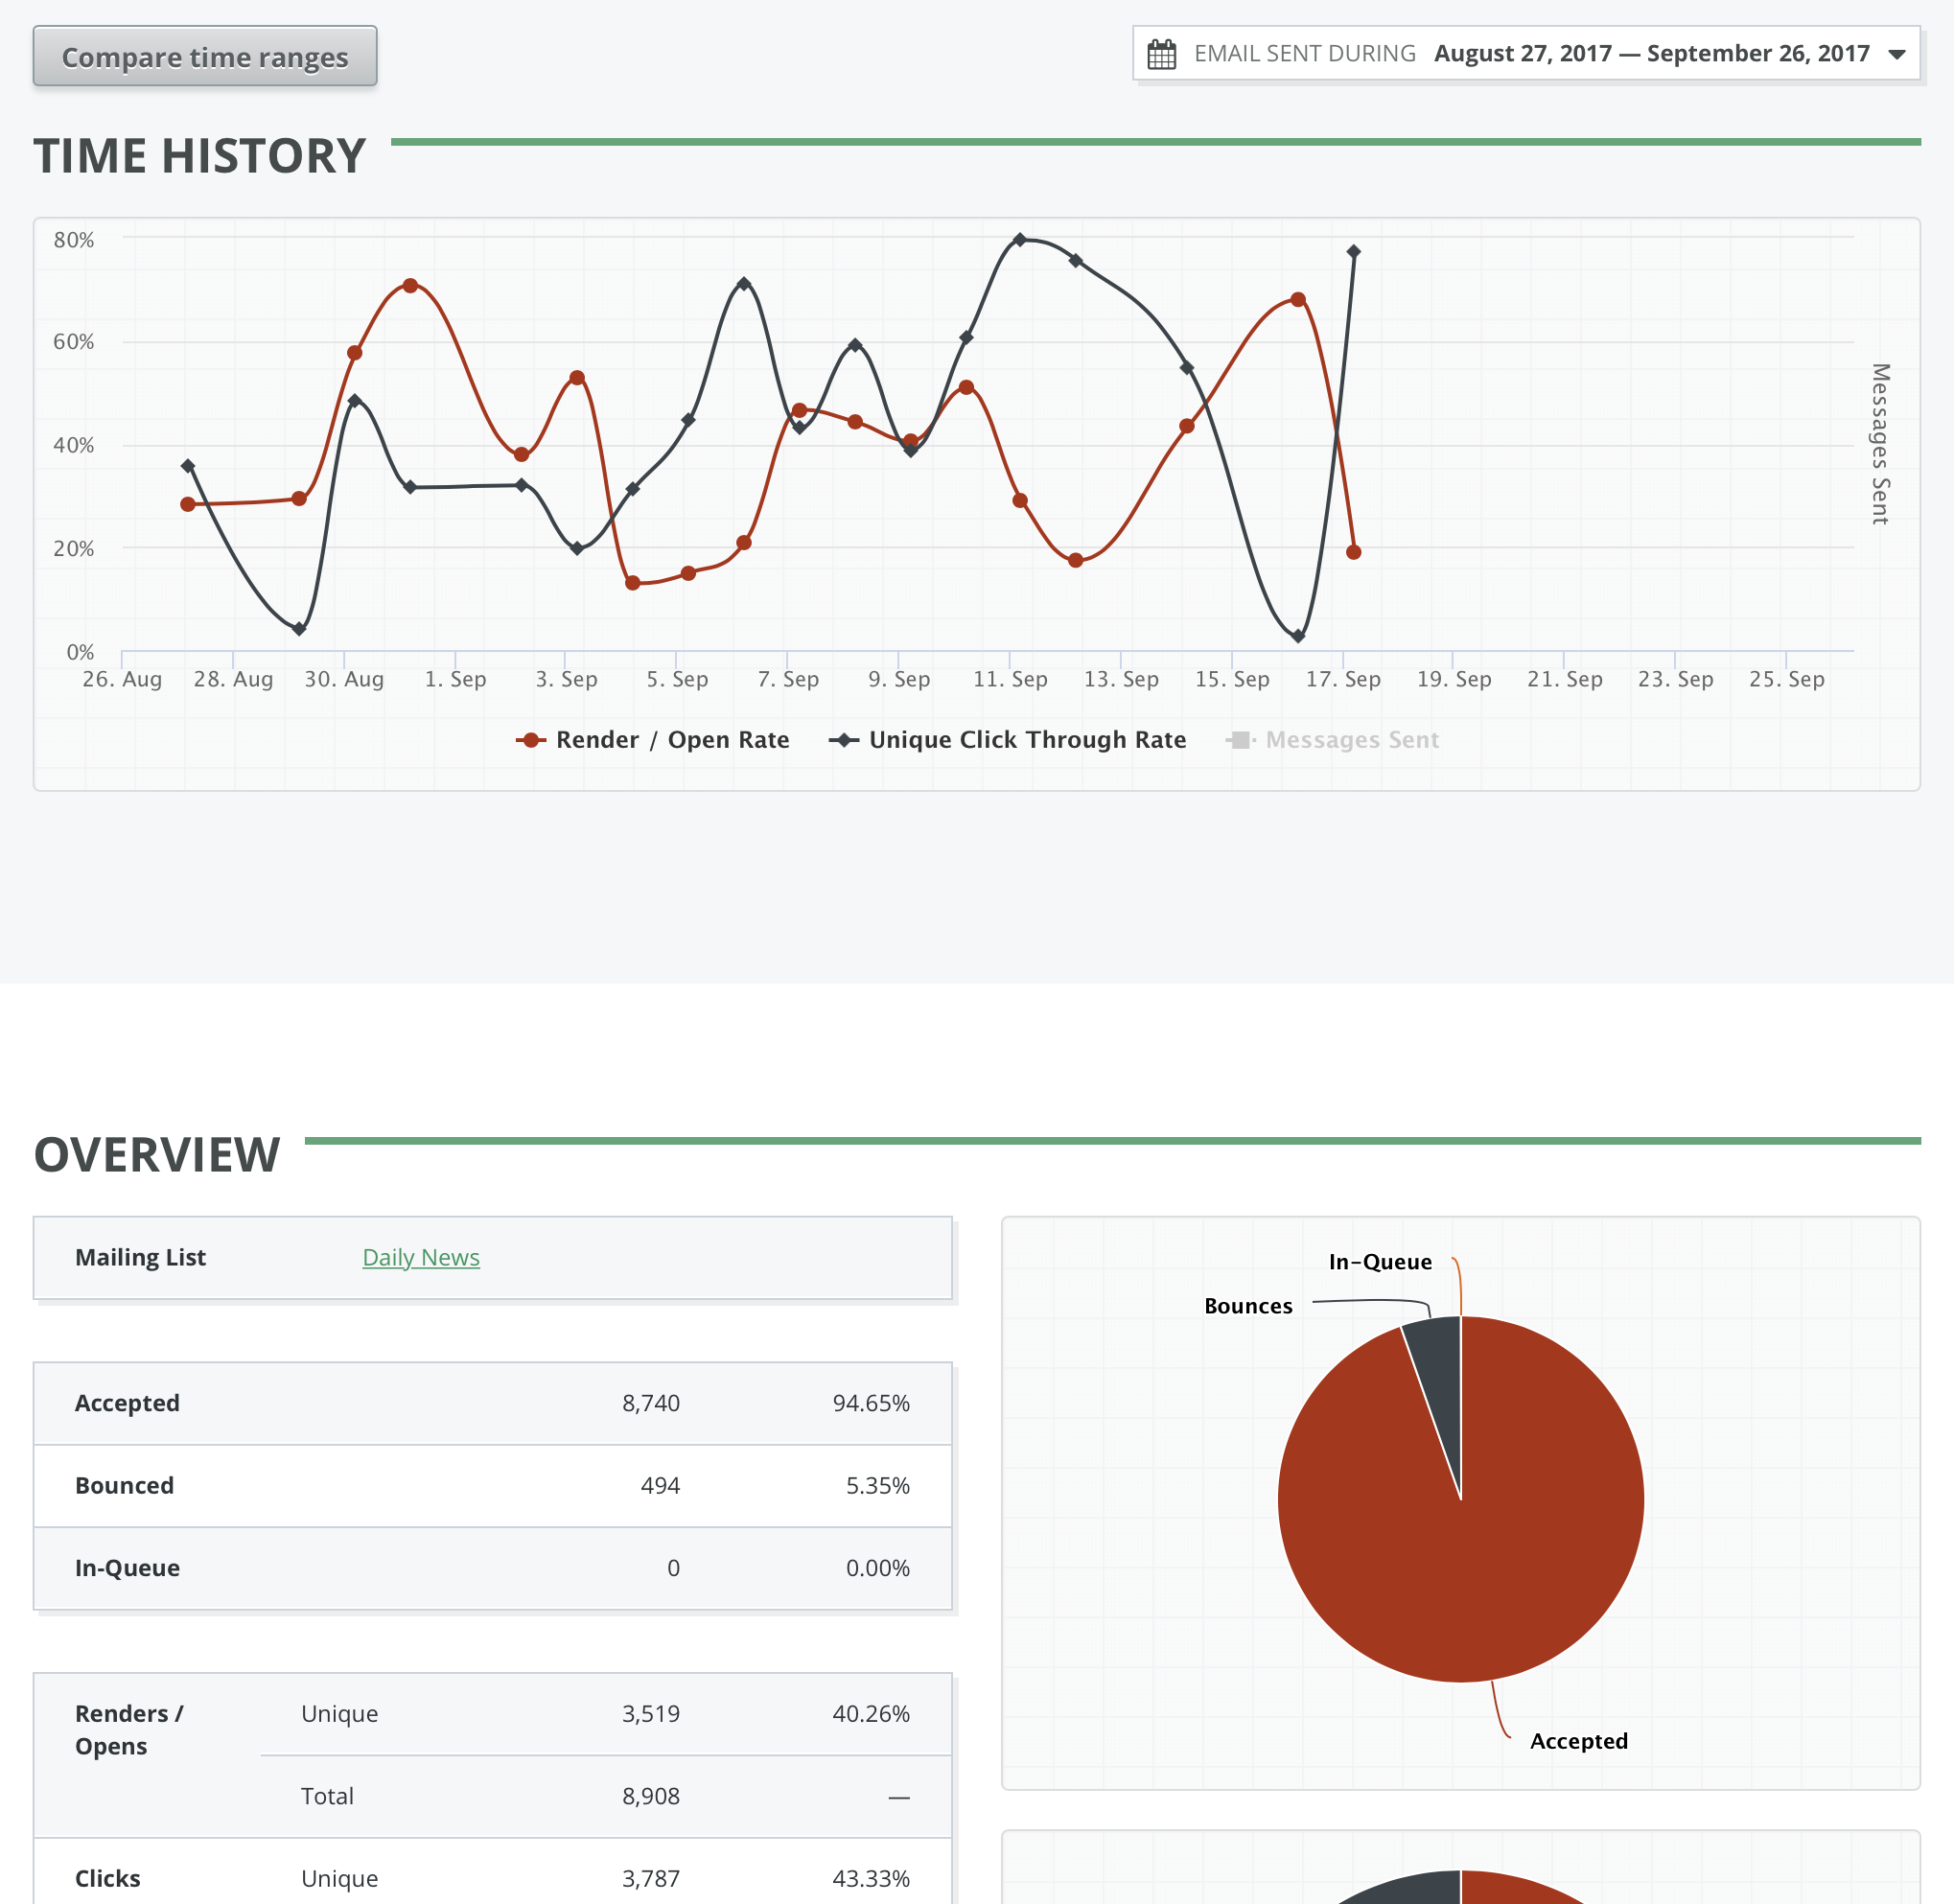
A summary of a mailing list’s performance can be viewed by clicking on the “Statistics” button, found on the mailing list’s page in the “Campaigns” section. The time range shown in this report can be adjusted using the “EMAIL
SENT DURING” filter at the top of the page.
This report gives an overview of all campaigns sent to this mailing list. At the top of the report is a time history, showing open and click performance. On that chart, you may click on “Messages Sent” to also show the volume of email sent to this list.

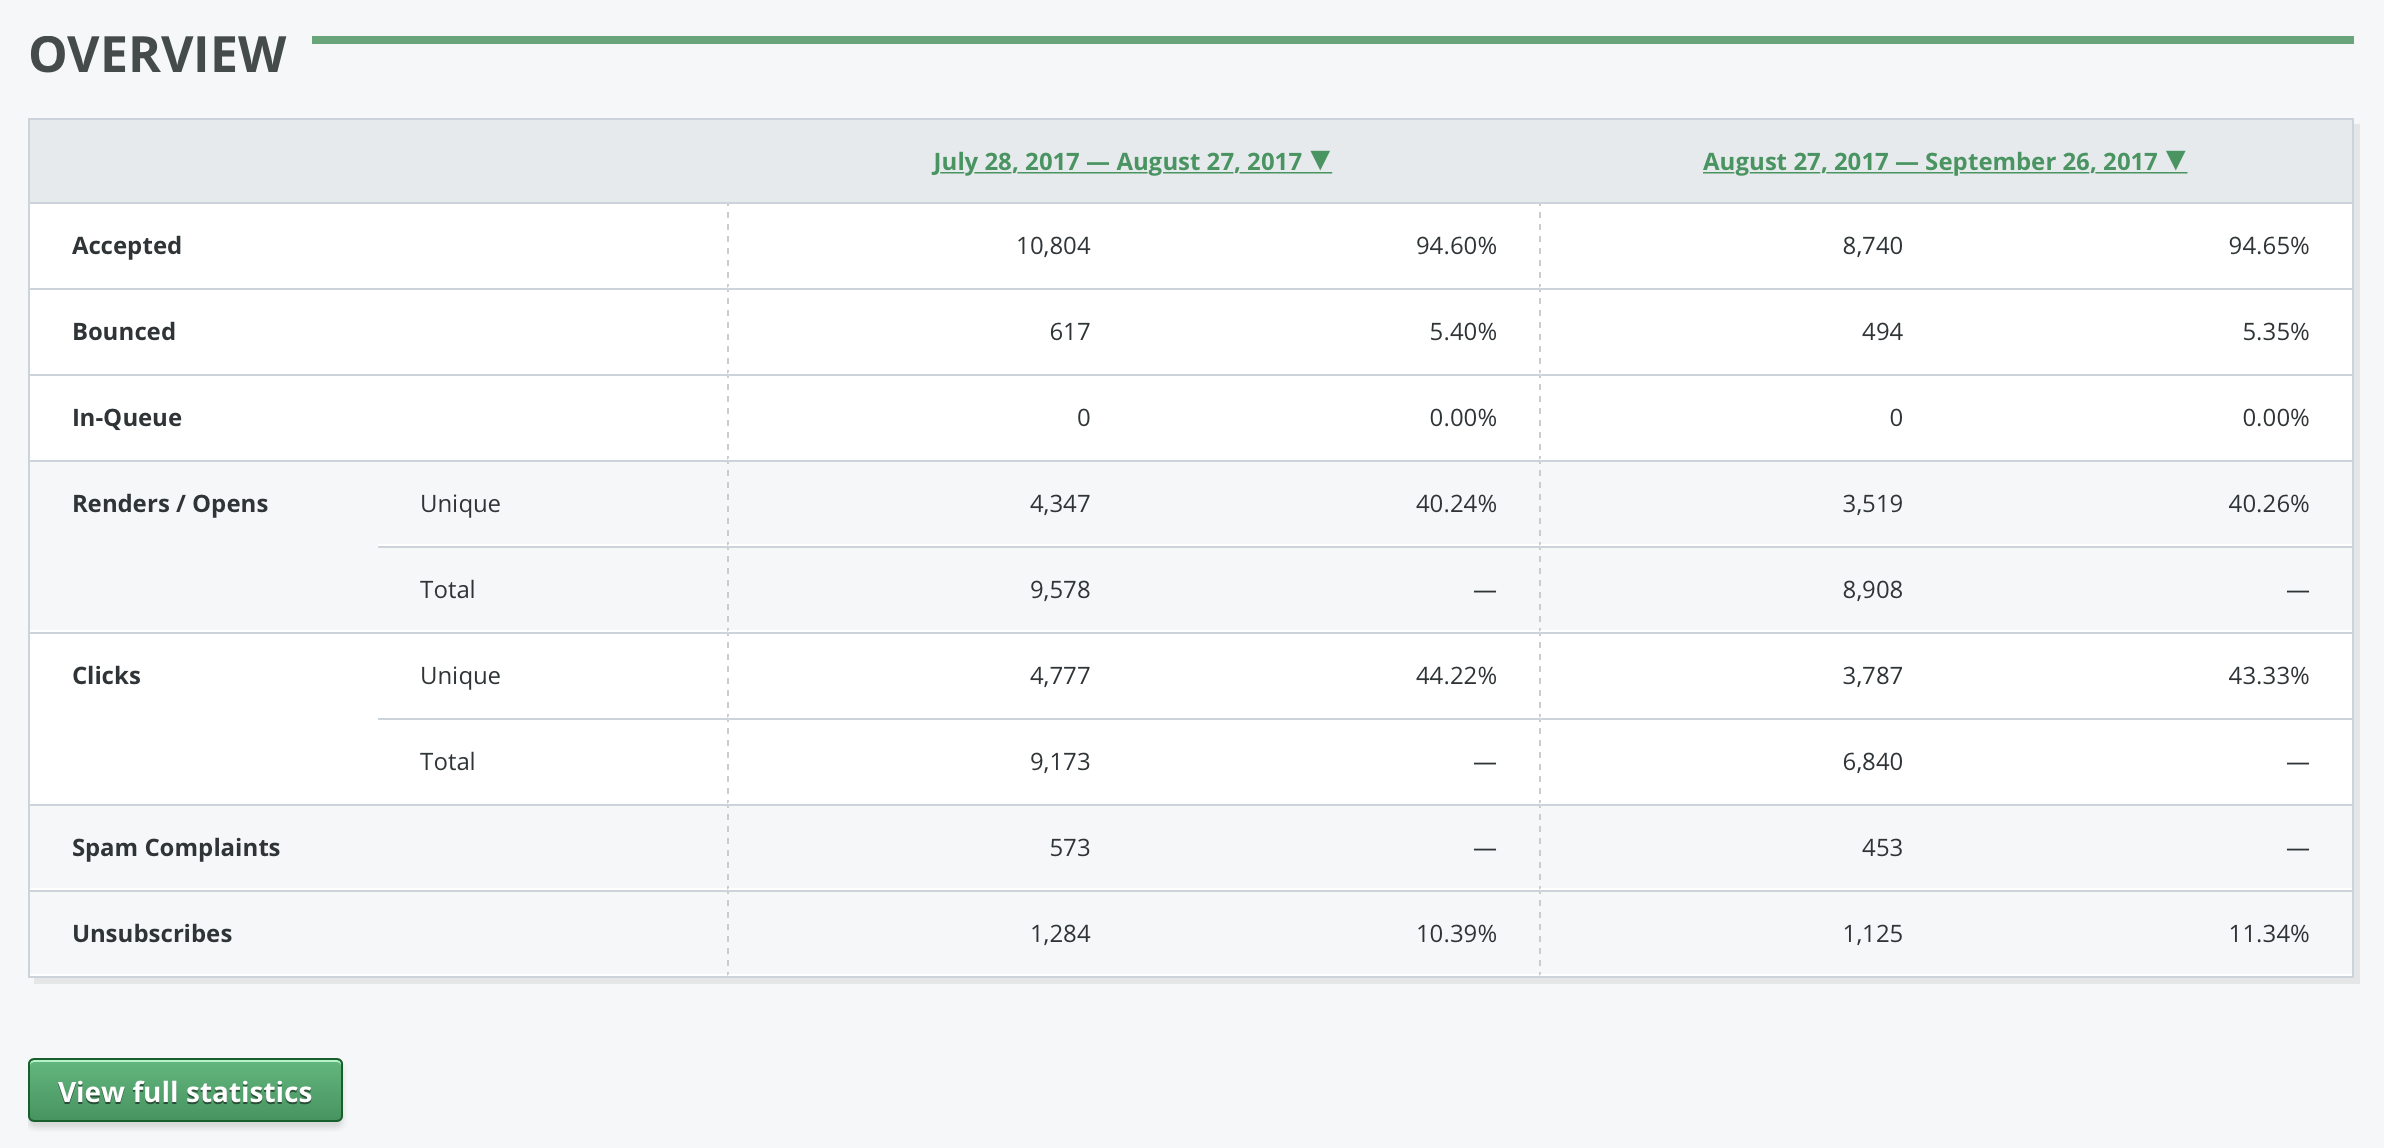
To compare how the mailing list has done over different time periods, click the “Compare time ranges” button. This comparison includes all of the major statistics shown on the overview page.

On this page, you may click the date headings to change the dates that are being compared.
